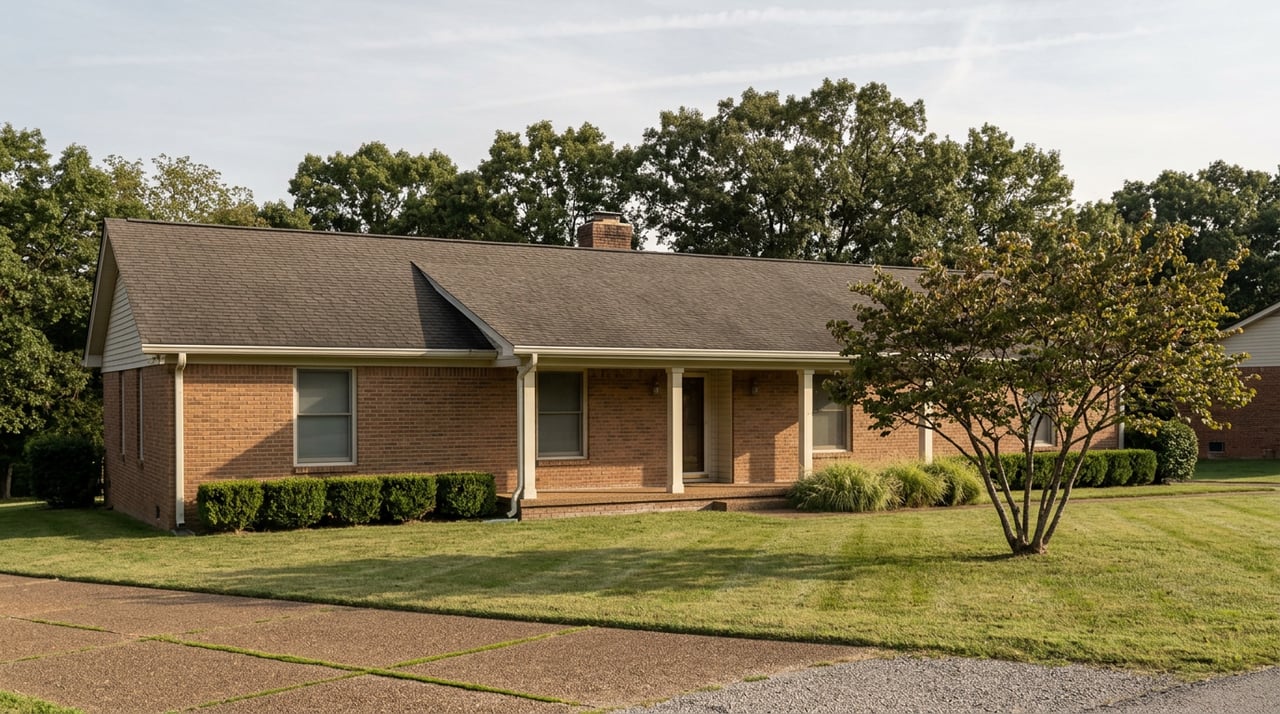
Why Park City, KY's Home Price Looks Different Every Time You Check It
September 24, 2026
September 24, 2026
Pull up three different sites for homes in Park City, Kentucky, and you will get three different answers to a question that should have one answer. One site will hand you a single average number for the whole zip code. Another will show you a wall of active listings ranging from a bank-owned foreclosure to a twelve-bedroom multi-family building. A third, Redfin, will simply have nothing. No median price, no trend line, no chart. That gap is not a glitch. It is what happens when a town small enough to fit inside one zip code gets measured by tools built for cities.
Park City sits in Barren County with a population right around 670 people. That size is exactly why the numbers you see online don't behave the way they do in Bowling Green or Glasgow. A handful of unusual sales can swing an average here in a way it never could in a bigger market, and understanding that swing is the difference between comparing towns honestly and comparing noise.
Zillow's home value index breaks its 42160 zip code data down by town tag. As of July 2026, here is what that per-town breakdown showed for a few of the communities sharing that zip code:
| Town | Zillow home value estimate (July 2026) |
|---|---|
| Park City | $168,908 |
| Brownsville | $175,502 |
| Glasgow | $188,685 |
| Smiths Grove | $225,331 |
| Mammoth Cave | $74,463 |
Look at that last row. A community tagged "Mammoth Cave" showing a value estimate under $75,000 is not a sign that the area around the park is collapsing. It's a sign of thin sample size in a place with very few residential sales to draw from, where one land parcel or one modest cabin can pull the whole number down. The same math applies at the other end of the table. Smiths Grove's higher figure reflects a different mix of newer construction closer to the interstate, not necessarily a town that's outpricing its neighbors house for house.
Redfin, by contrast, gives Park City nothing at all. Open its dedicated market page for the town and you'll find a generic template with no price trend, no median, no days-on-market figure. That leaves no town-specific figures to compare.
The clearest way to see the problem is to look at what was actually listed in Park City in September 2026. On one site alone, the spread looked like this:
That is not a normal distribution of houses. That is a foreclosure, a converted multi-family building, a raw land tract next to a national park, and new construction, all sharing the same "Park City, KY" label on the same page. A separate listing tracker for the town put the full range at $79,900 to $739,900 across its active inventory, with a median list price near $149 per square foot. Average any handful of those together and you get a number that describes none of them particularly well.
Barren County as a whole sells enough homes each month that one unusual transaction barely registers. Park City doesn't have that cushion. When a town this size sees even a few land sales, foreclosures, or acreage tracts close in the same stretch, those sales carry disproportionate weight in whatever average gets published next.
The Zion Cemetery Road parcel is a good example of why this happens here specifically. That tract borders Mammoth Cave National Park directly, on two sides, which means there's limited private land around it and a built-in draw for buyers who want land adjacent to the park rather than a house in town. Land like that sells on a completely different logic than a three-bedroom house on Blakeman Street. It gets shopped by hunters, campers, and people building a cabin from scratch, not by someone comparing school pickup routes. When a portal folds that sale into the same "Park City" number as a modest in-town house, it's averaging two different markets and calling the result one town.
If you're deciding between towns along this stretch of I-65, the town-tag averages you'll find online are a starting point, not a conclusion. A $168,908 figure for Park City and a $225,331 figure for Smiths Grove might tell you something real about the mix of housing stock in each place, or they might just be reflecting whatever handful of sales happened to close that quarter in each zip.
The more reliable comparison is a straight one: pull the actual sale prices of in-town, single-family houses on standard lots in each town over the same recent window, and set those side by side. Leave the acreage tracts, the foreclosures, and the multi-family conversions out of that first pass. Once you know what a typical in-town house costs in each place, you can layer the land and specialty properties back in as a separate conversation, because that's genuinely a different kind of purchase with a different kind of buyer.
If you're the one selling in Park City, this cuts the other way. Your comp pool is small enough that a single unusual closing nearby, a land sale, a fixer bought at auction, can shift the number a buyer's agent shows their client before they ever walk through your door. Knowing which recent sales in your zip code actually match your house, and which ones are distorting the picture, is worth more here than in a market with hundreds of monthly closings to smooth things out.
What does Redfin show for Park City specifically? Redfin's dedicated market page for Park City shows no price trend, median, or days-on-market figure.
Why is the "Mammoth Cave" price so much lower than everything around it? The area tagged Mammoth Cave in most zip-code breakdowns has very few residential sales to draw from. A single land parcel or modest cabin sale can pull that average far below what similar houses cost just a few miles away in Park City or Cave City.
How should I actually compare prices between towns like Park City, Smiths Grove, and Glasgow? Start with recent sales of comparable in-town houses, similar size, similar lot, similar age, rather than the town-wide average. Land, acreage, and specialty properties should be compared separately, since they answer a different question than "what does a typical house here cost."
If you're weighing Park City against the towns around it, or trying to make sense of a number that doesn't match what you're seeing on a drive through town, that's exactly the kind of question Shauna Gravil works through with buyers and sellers across this corridor every week. Schedule a free consultation and get a straight read on what your specific property, or your specific budget, actually looks like against the real comps, not the averages.
Stay up to date on the latest real estate trends.
Experience personalized service, expert negotiation, and a commitment to achieving your real estate goals.